Recently, I published a couple of posts on both LinkedIn and Medium in parallel. The process was as follows:
- Post an identical text on LinkedIn and Medium within minutes of each other (with public viewing permission).
- Create a single Facebook post letting people know about both posts and containing links to the posts on the two platforms.
- Sit back and observe the number of views, likes, and comments and how they change over time.
Since both platforms have an analytics dashboard it was possible to compare the statistics from both systems and draw conclusions. Below, I include some observations regarding my most recent parallel post and discuss some conclusions. This investigation is certainly anecdotal, but I did see similar trends looking at an older parallel post.
The parallel post in question is “The Unintended Consequences and Negative Impact of New Machine Learning Applications”, and the links to the posts on both platforms are here and here. Both posts were published on July 15 and were followed by a Facebook post on the same day that provided initial traffic.
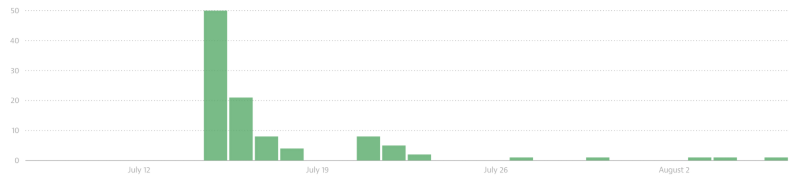
Between July 15 and August 6 (date of writing this post) Medium reported 103 views, a single recommendation (equivalent to like), and no comments. The graph below shows daily views by date.
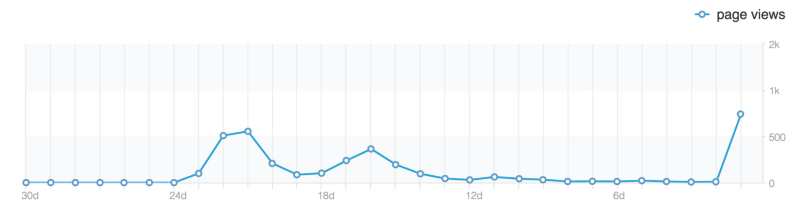
During the same period, LinkedIn reported 3517 views, 180 likes, and 21 comments. The graph below shows daily views by date, counting backwards from August 6th.
Here are a few observations.
*The LinkedIn post had many more views than the Medium post (about 30 times more). It also had many more likes and comments than the medium post (180 times more likes and an increase for comments from 0 to 21). * The number of likes per view was much higher in the case of LinkedIn (a 5 times increase from 1% to 5%). * Both graphs show two modes early on with the first larger mode following the publication date and the second smaller mode trailing by about 7 days afterwards. * Medium’s two modes have a strong monotonic decay after an initial big spike. For example, the highest number of views was achieved on the day of publication (50% of the total views!), followed by a much smaller view count on the next page, followed by an even smaller view count on the next day. LinkedIn’s modes are more symmetric: the views increase gradually to a maximum value and then gradually decrease. * The Medium post was pretty much dead after 9 days reaching 0 or 1 daily views, while the LinkedIn post was alive for three weeks with considerable views (the y axis is hard to read, but the days between -12d and -2d had about 10 daily views). * The LinkedIn post shows a huge spike on the last day (Aug 6) to 780 views.
Why do we see these striking differences given that both posts were identical and both were directed the same initial traffic using the Facebook post? There are several reasons, but they all revolve around network effects and viral loops effects.
When a post is shared on either LinkedIn or Medium, it is shown in the news feeds of other users and in particular of other users who follow or connect to the author. In my case, I have close to 2000 followers and connections on LinkedIn, but only about 22 followers on Medium. This network effect will cause my post to appear in news feeds belonging to many more users in LinkedIn than in Medium.
Furthermore, when a post is liked or re-shared (or commented on), an update is created to describe this activity of the form: “your connection X liked this post”. This viral update appears in news feeds of other users that are connected to the person creating the viral update and that may not be in the network of the original poster. Such viral updates can cause additional exposure beyond the author’s network that will lead to additional likes or comments that will in turn lead to additional viral loop updates and more exposure. This cascade of viral updates may take time to fully develop, explaining the gradual increase in page views in LinkedIn until hitting the mode. The small network effect and lack of viral updates on Medium caused the page views there to have a shape of a spike followed by monotonic decay.
The sharp increase in page views on the last day in the LinkedIn graph is due to a highly connected and influential user (Jeff Weiner) mentioning the article in a status update. This is an extreme demonstration of how a single viral loop can bring a 3 weeks old post back to life, generating 700+ daily views — more than 7 times Medium’s total number of page views.
Since LinkedIn has a much bigger and denser network, its network effect and viral loops are much more efficient than Medium’s. It is not a surprising or new observation, and in fact it is at the heart of Medium’s new strategy to focus more on building a social network rather than continue to be a classical blogging platform. Medium’s CEO noted in May 2015 that “We’ve shifted more of our attention on the product side from creating tool value to creating network value” and “It’s all about the network”. Indeed, Without good network effects and viral loops Medium is going to have a hard time competing.
By the way, this post is also a parallel post that I am posting on both LinkedIn and Medium (you are reading one of these versions—you probably know which one). I will monitor the analytics for this post on both platforms and post as a comment what happened to both the “unintended consequences” blog post and this post after its publication.