5.4. Mixture Random Vectors
Mixture random vectors are the direct multivariate analog of mixture random variables (see Section 3.13).Since the weights sum to one, the above functions are valid pdf or pmf and thus uniquely characterize the mixture distribution. The moments of a mixture random vector are linear combinations of the corresponding moments of the individual random vectors (see Section 3.13).
As in the univariate case of Section 3.13, mixture distributions are able to capture a wide variety of complex distributions. For example, a mixture of $k$ multivariate Gaussians can capture a distribution with $k$ modes. Mixture distributions are particularly applicable to situations when the vector is determined via a two stage experiment: first a mixture component is chosen, and then the vector value is determined from the appropriate mixture component. For example, consider the situation of taking multiple physiological measurements (e.g., height, weight) of a person, drawn at random from a population containing multiple ethnicities such as African, Asian, and Caucasian. If the disparities in the physiological measurements between the ethnicities are high relative to the disparities within each ethnicity, a mixture distribution will be appropriate where $\bb\alpha$ corresponds to the proportions of different ethnicities in the population and ${\bb X}^{(i)}$, $i=1,\ldots,k$ corresponds to the measurement vector distribution within the different ethnicities. If, on the other hand, the measurement disparity between ethnicities is low relative to the disparities within each ethnicity a simpler non-mixture model may be preferred.
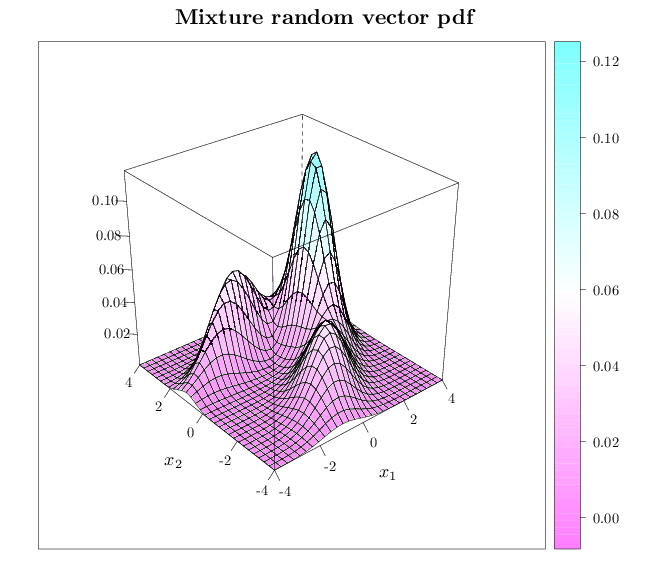
The R code below graphs the pdf of a mixture of two dimensional Gaussian random vectors.
library(lattice)
trellis.par.set(list(fontsize = list(text = 18)))
R = expand.grid(seq(-4, 4, length = 30), seq(-4, 4,
    length = 30))
names(R) = c("x1", "x2")
R$p = dmvnorm(R, mean = c(2, 1), sigma = matrix(c(0.5,
    0.2, 0.2, 1), nrow = 2, ncol = 2))/2 + dmvnorm(R,
    mean = c(-1, 2), sigma = matrix(c(2, 0.7, 0.7,
        0.5), nrow = 2, ncol = 2))/4 + dmvnorm(R, mean = c(0,
    -2), sigma = matrix(c(1, 0.5, 0.5, 1), nrow = 2,
    ncol = 2))/4
wireframe(p ~ x1 + x2, data = R, xlab = "$x_1$", ylab = "$x_2$",
    zlab = "", main = "Mixture random vector pdf",
    scales = list(arrows = FALSE), drape = TRUE)