Preface
The Analysis of Data Project
The Analysis of Data (TAOD) project provides educational material on the area of data analysis.
- The project features comprehensive coverage of all relevant disciplines including probability, statistics, computing, and machine learning.
- The content is almost self-contained and includes mathematical prerequisites and basic computing concepts.
- The R programming language is used to demonstrate the contents. Full code is available, facilitating reproducibility of experiments and letting readers experiment with variations of the code.
- The presentation is mathematically rigorous, and includes derivations and proofs in most cases.
- HTML versions are freely available on the website http://theanalysisofdata.com. Hardcopies are available at affordable prices.
Volume 1: Probability
This volume focuses on probability theory. There are many excellent textbooks on probability, and yet this book differs from others in several ways.- Probability theory is a wide field. This book focuses on the parts of probability that are most relevant for statistics and machine learning.
- The book contains almost all of the mathematical prerequisites, including set theory, metric spaces, linear algebra, differentiation, integration, and measure theory.
- Almost all results in the book appear with a proof.
- Probability textbooks are typically either elementary or advanced. This book strikes a balance by attempting to avoid measure theory where possible, but resorting to measure theory and other advanced material in a few places where they are essential.
- The book uses R to illustrate concepts. Full code is available in the book, facilitating reproducibility of experiments and letting readers experiment with variations of the code.
I am not aware of a single textbook that covers the material from probability theory that is necessary and sufficient for an in-depth understanding of statistics and machine learning. This book represents my best effort in that direction.
Since this book is part of a series of books on data analysis, it does not include any statistics or machine learning. Such content is postponed to future volumes.
Website
A companion website http://theanalysisofdata.com contains an HTML version of this book, errata, and additional multimedia material. The website will also link to additional TAOD volumes as they become available.Mathematical Appendices
A large part of the book contains six appendices on mathematical prerequisites. Probability requires knowledge of many branches of mathematics, including calculus, linear algebra, set theory, metric spaces, measure, and Lebesgue integration. Instead of referring the reader to a large collection of math textbooks we include here all of the necessary prerequisites. References are provided in the notes sections at the end of each chapter for additional resources.
Dependencies
The diagram below indicates the dependencies between the different chapters of the book. Appendix chapters are shaded and dependencies between appendix chapters and regular chapters are marked by dashed arrows. It is not essential to strictly adhere to this dependency as many chapters require only a brief familiarity with some issues in the chapters that they depend on.
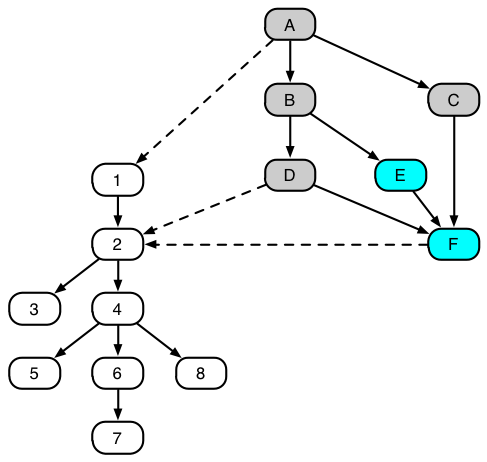
Starred sections correspond to material that requires measure theory, or that can be better appreciated with knowledge of measure theory.
R Code
The book contains many fragments of R code, aimed to illustrate probability theory and its applications. The code is included so that the reader can reproduce the results as well as modify the code and run variations of it. In order to appreciate the code and modify it, the reader will need a basic understanding of the R programming language and R graphics. A good introduction to R is available from the CRAN website at http://cran.r-project.org/doc/manuals/R-intro.pdf. Alternatively, two chapters from volume 2 of the analysis of data series (R Programming and R Graphics) are freely available online at http://theanalysisofdata.com.The book uses a variety of R graphics packages, including base, lattice, and ggplot2. The most frequently used package is ggplot2, which is described in detail in (Wickham, 2009) (see also http://had.co.nz/ggplot2 and the R Graphics chapter available at http://theanalysisofdata.com).
To ensure that the code fragments run locally as they appear in the book, install and bring into scope the required packages using the install.packages and library R functions. For example, to install and load the ggplot2 package type the following commands in the R prompt.
# this is a comment
install.packages("ggplot2")  # installs the package ggplot2
library("ggplot2")  # brings ggplot2 into scope
The code fragments throughout the book are annotated with output displayed by the R interpreter. This output is displayed following two hash symbols which are interpreted as comments by R (see below).
a = pi
print(a)  # note the ## symbols preceding the output below
## [1] 3.142
print(a + 1)
## [1] 4.142
This format makes it easy to copy a code fragment from an HTML page and paste it directly into R (the output following the hash symbols will be interpreted as comments and not produce a syntax error).
Acknowledgements
The following people made technical suggestions that helped improve the contents: Krishnakumar Balasubramanian, Rohit Banga, Joshua Dillon, Sanjeet Hajarnis, Oded Green, Yi Mao, Seungyeon Kim, Joonseok Lee, Fuxin Li, Nishant Mehta, Parikshit Ram, Kaushik Rangadurai, Neil Slagle, Mingxuan Sun, Brian Steber, Gena Tang, Long Tran. In addition, many useful comments were received through a discussion board during my fall 2011 class computational data analysis at Georgia Tech. These comments were mostly anonymized, but some commentators who identified themselves appear above.Katharina Probst, Neil Slagle and Laura Usselman edited portions of this book, and made many useful suggestions. The book features a combination of text, equations, graphs, and R code, made possible by the knitr package. I thank Yihui Xie for implementing knitr, and for his help through the knitr Google discussion group. Katharina Probst helped with web development and design.